快速开始
我们先用几个小例子,快速入门cnmaps的基本功能的使用。
查询行政边界
你可以使用 get_adm_maps 轻松查询到你想要的行政边界,例如你想要查询北京市,可以使用以下方式。
In [1]: from cnmaps import get_adm_maps

In [2]: get_adm_maps(city='北京市')
Out[2]:
[{'国家': '中华人民共和国',
'省/直辖市': '北京市',
'市': '北京市',
'区/县': None,
'级别': '市',
'来源': '高德',
'类型': '陆地',
'geometry': <cnmaps.maps.MapPolygon at 0x7f861690c050>}]
查询海淀区。
In [1]: from cnmaps import get_adm_maps

In [2]: get_adm_maps(district='海淀区')
Out[2]:
[{'国家': '中华人民共和国',
'省/直辖市': '北京市',
'市': '北京市',
'区/县': '海淀区',
'级别': '区县',
'来源': '高德',
'类型': '陆地',
'geometry': <cnmaps.maps.MapPolygon at 0x7f861af85fd0>}]
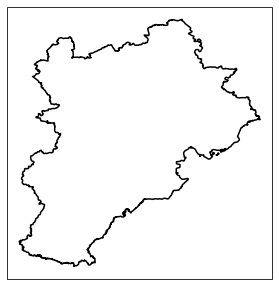
查询山西省。
In [1]: from cnmaps import get_adm_maps

In [2]: get_adm_maps(province='山西省')
Out[2]:
[{'国家': '中华人民共和国',
'省/直辖市': '山西省',
'市': None,
'区/县': None,
'级别': '省',
'来源': '高德',
'类型': '陆地',
'geometry': <cnmaps.maps.MapPolygon at 0x7f8618f86790>}]
查询山西省下辖地级市。
In [1]: from cnmaps import get_adm_maps

In [2]: get_adm_maps(province='山西省', level='市')
Out[2]:
[{'国家': '中华人民共和国',
'省/直辖市': '山西省',
'市': '太原市',
'区/县': None,
'级别': '市',
'来源': '高德',
'类型': '陆地',
'geometry': <cnmaps.maps.MapPolygon at 0x7f863fd618d0>},
... # 为节省篇幅,中间部分省略
'省/直辖市': '山西省',
'市': '吕梁市',
'区/县': None,
'级别': '市',
'来源': '高德',
'类型': '陆地',
'geometry': <cnmaps.maps.MapPolygon at 0x7f863fd613d0>}]

In [3]: get_adm_maps(province='山西省', level='市', engine='geopandas')
Out[3]:
        国家 省/直辖市    市   区/县 级别  来源  类型                                           geometry
0   中华人民共和国   山西省  太原市  None  市  高德  陆地  MULTIPOLYGON (((113.06683 38.05646, 113.06708 ...
1   中华人民共和国   山西省  大同市  None  市  高德  陆地  MULTIPOLYGON (((113.57727 39.43812, 113.57460 ...
2   中华人民共和国   山西省  阳泉市  None  市  高德  陆地  MULTIPOLYGON (((113.99691 37.70448, 113.99567 ...
3   中华人民共和国   山西省  长治市  None  市  高德  陆地  MULTIPOLYGON (((111.99642 36.68713, 111.99480 ...
4   中华人民共和国   山西省  晋城市  None  市  高德  陆地  MULTIPOLYGON (((113.46543 35.51493, 113.46300 ...
5   中华人民共和国   山西省  朔州市  None  市  高德  陆地  MULTIPOLYGON (((112.62431 40.23685, 112.62429 ...
6   中华人民共和国   山西省  晋中市  None  市  高德  陆地  MULTIPOLYGON (((113.06683 38.05646, 113.06903 ...
7   中华人民共和国   山西省  运城市  None  市  高德  陆地  MULTIPOLYGON (((110.90373 34.66882, 110.89349 ...
8   中华人民共和国   山西省  忻州市  None  市  高德  陆地  MULTIPOLYGON (((111.26944 39.42373, 111.27091 ...
9   中华人民共和国   山西省  临汾市  None  市  高德  陆地  MULTIPOLYGON (((110.41054 36.89947, 110.41487 ...
10  中华人民共和国   山西省  吕梁市  None  市  高德  陆地  MULTIPOLYGON (((111.41469 36.80403, 111.41071 ...
备注
当你向 get_adm_maps 传递行政区域的名称时,应传入行政区的正式全称,简称无法识别,如果不知道全称可以通过 get_adm_names 查询。
假如我们不知道省一级行政区的正式名称,可以执行:
In [1]: from cnmaps import get_adm_names

In [2]: get_adm_names(level='省')
Out[2]:
['北京市',
'天津市',
'河北省',
... # 为节省篇幅,中间部分省略
'台湾省',
'香港特别行政区',
'澳门特别行政区']
当我们已经知道了省的名称以后,可以继续下探到市,以四川省为例:
In [1]: from cnmaps import get_adm_names

In [2]: get_adm_names(province='四川省', level='市')
Out[2]:
['成都市',
'自贡市',
'攀枝花市',
... # 为节省篇幅,中间部分省略
'阿坝藏族羌族自治州',
'甘孜藏族自治州',
'凉山彝族自治州']
知道了市的名称以后,可以继续下探到区县,以成都市为例:
In [1]: from cnmaps import get_adm_names

In [2]: get_adm_names(province='四川省', city='成都市', level='区县')
Out[2]:
['锦江区',
'青羊区',
'金牛区',
... # 为节省篇幅,中间部分省略
'邛崃市',
'崇州市',
'简阳市']
绘制行政边界
前面使用 get_adm_maps 获取的行政边界地图列表,可以直接传入 draw_maps 函数进行绘图。
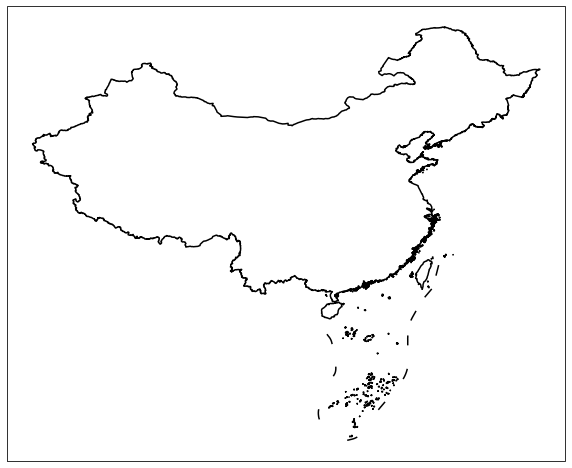
我们先来用最简单直接的方式,来绘制你的第一张中国国界地图。
import cartopy.crs as ccrs
import matplotlib.pyplot as plt
from cnmaps import get_adm_maps, draw_maps

fig = plt.figure(figsize=(10,10))
ax = fig.add_subplot(111, projection=ccrs.PlateCarree())

draw_maps(get_adm_maps(level='国'))

plt.show()
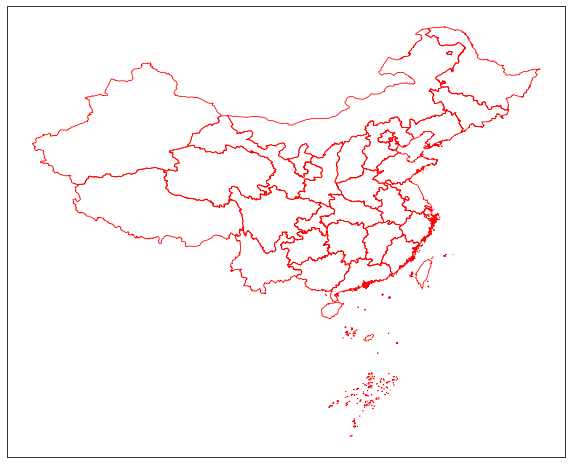
我们再来绘制一张各省的行政边界地图。
import cartopy.crs as ccrs
import matplotlib.pyplot as plt
from cnmaps import get_adm_maps, draw_maps

fig = plt.figure(figsize=(10,10))
ax = fig.add_subplot(111, projection=ccrs.PlateCarree())

draw_maps(get_adm_maps(level='省'), linewidth=0.8, color='r')

plt.show()
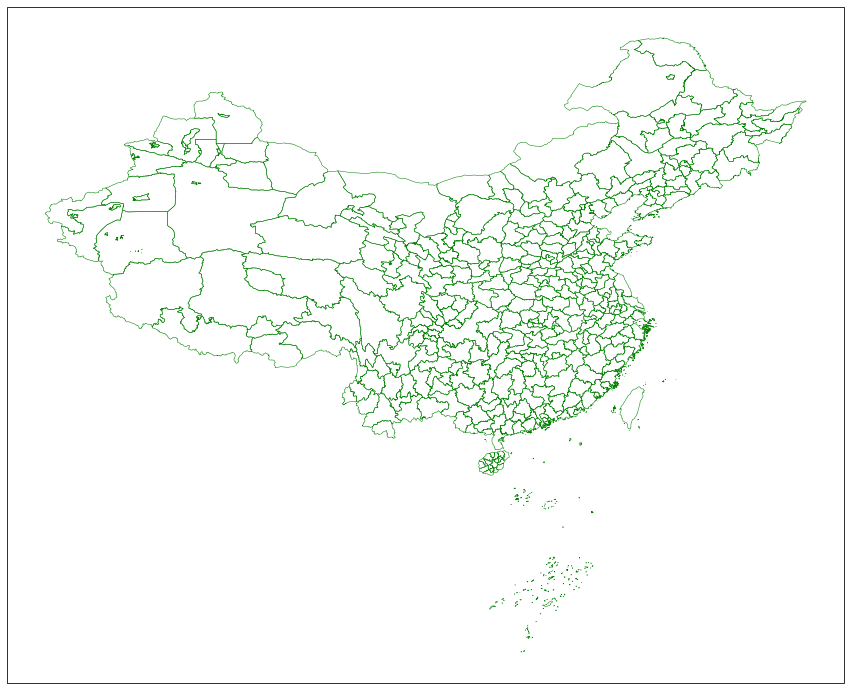
然后是市级行政区。
import cartopy.crs as ccrs
import matplotlib.pyplot as plt
from cnmaps import get_adm_maps, draw_maps

fig = plt.figure(figsize=(15,15))
ax = fig.add_subplot(111, projection=ccrs.PlateCarree())

draw_maps(get_adm_maps(level='市'), linewidth=0.5, color='g')

plt.show()
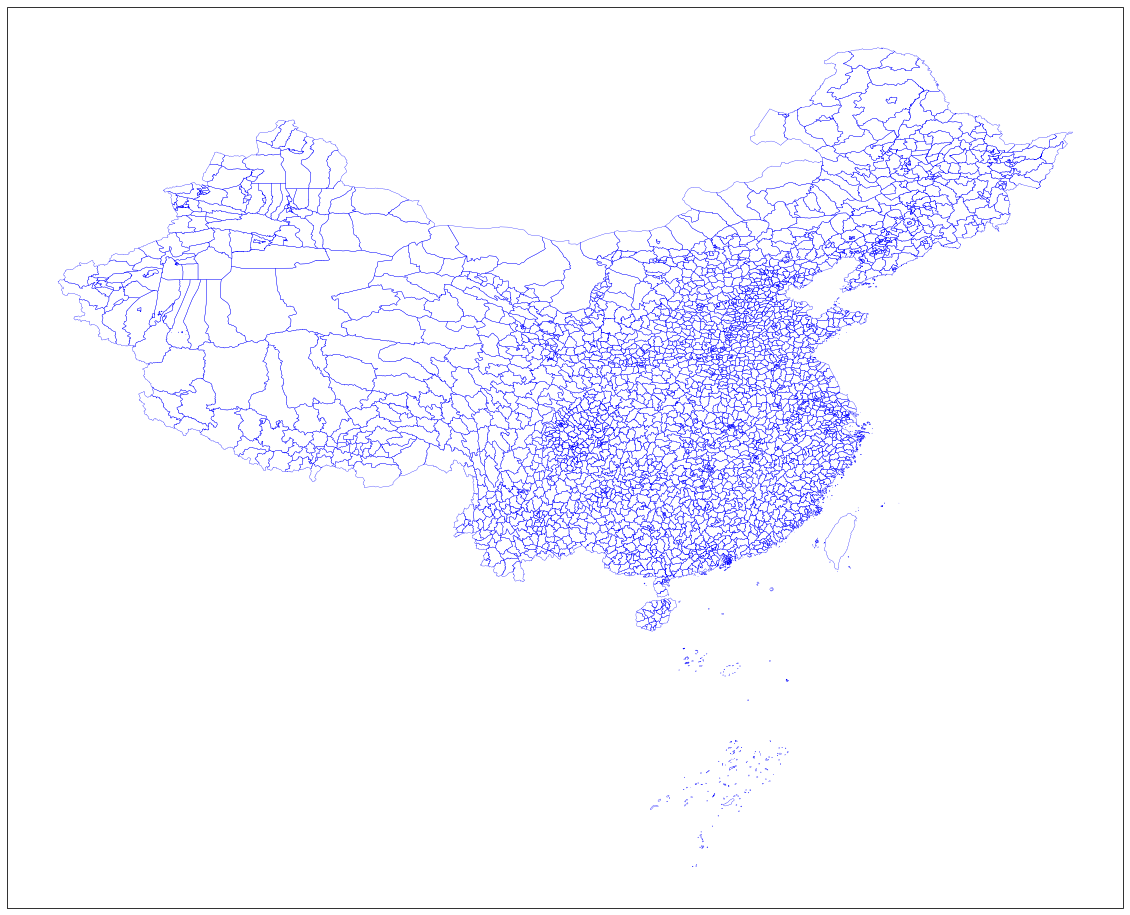
最后是区县。
import cartopy.crs as ccrs
import matplotlib.pyplot as plt
from cnmaps import get_adm_maps, draw_maps

fig = plt.figure(figsize=(20,20))
ax = fig.add_subplot(111, projection=ccrs.PlateCarree())

draw_maps(get_adm_maps(level='区县'), linewidth=0.3, color='b')

plt.show()
合并边界
cnmaps可以很方便地对地图进行合并,例如我们可以将北京、天津、河北的边界对象直接相加获得京津冀的边界对象并绘图。
import cartopy.crs as ccrs
import matplotlib.pyplot as plt
from cnmaps import get_adm_maps, draw_map

beijing = get_adm_maps(province='北京市', only_polygon=True, record='first')
tianjin = get_adm_maps(province='天津市', only_polygon=True, record='first')
hebei = get_adm_maps(province='河北省', only_polygon=True, record='first')

jingjinji = beijing + tianjin + hebei

fig = plt.figure(figsize=(5,5))
ax = fig.add_subplot(111, projection=ccrs.PlateCarree())
draw_map(jingjinji)

plt.show()
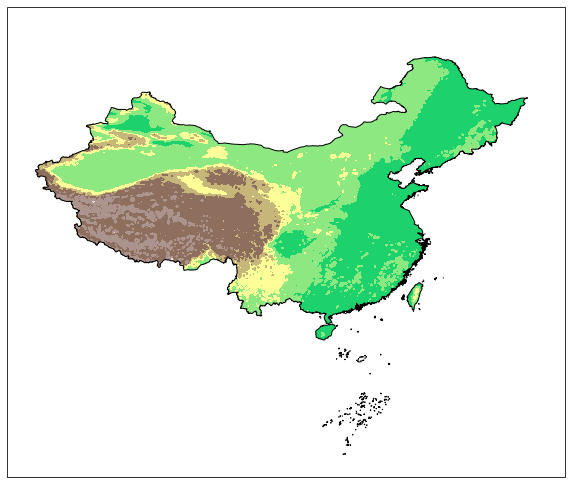
剪切地图
剪切填色等值线(contourf)图
from cnmaps import get_adm_maps, clip_contours_by_map, draw_map
from cnmaps.sample import load_dem

lons, lats, data = load_dem()

fig = plt.figure(figsize=(10, 10))
ax = fig.add_subplot(111, projection=ccrs.PlateCarree())
map_polygon = get_adm_maps(country='中华人民共和国', record='first', only_polygon=True)

cs = ax.contourf(lons, lats, data,
                cmap=plt.cm.terrain,
                levels=np.linspace(-2800, data.max(), 10),
                transform=ccrs.PlateCarree())

clip_contours_by_map(cs, map_polygon)
draw_map(map_polygon, color='k', linewidth=1)

plt.show()
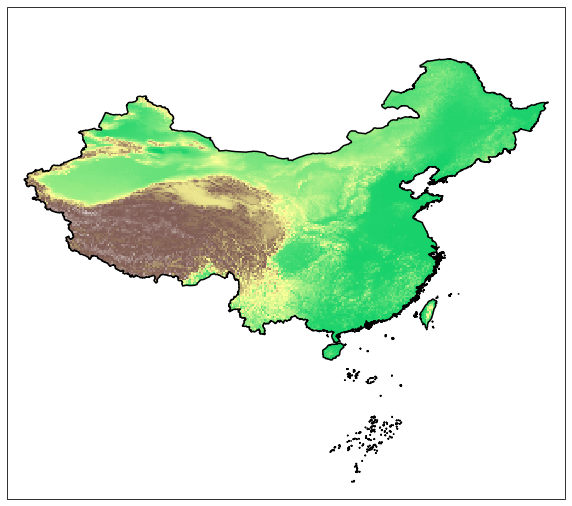
剪切填色(pcolormesh)图
import cartopy.crs as ccrs
import matplotlib.pyplot as plt
from cnmaps import get_adm_maps, draw_map, clip_pcolormesh_by_map
from cnmaps.sample import load_dem

lons, lats, dem = load_dem()
fig = plt.figure(figsize=(10, 10))

map_polygon = get_adm_maps(country='中华人民共和国', record='first', only_polygon=True)

ax = fig.add_subplot(111, projection=ccrs.PlateCarree())
mesh = ax.pcolormesh(lons, lats, dem, cmap=plt.cm.terrain, vmin=-2800, transform=ccrs.PlateCarree())
clip_pcolormesh_by_map(mesh, map_polygon)
draw_map(map_polygon, color='k')
ax.set_extent(map_polygon.get_extent())

plt.show()
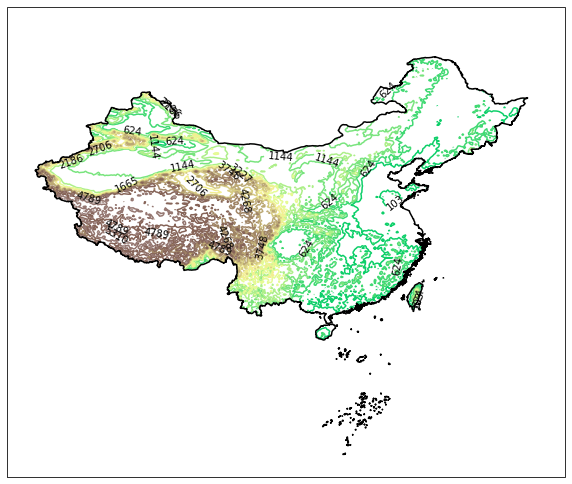
剪切等值线clabel
from cnmaps import get_adm_maps, clip_clabels_by_map, clip_contours_by_map, draw_map
from cnmaps.sample import load_dem

lons, lats, data = load_dem()

map_polygon = get_adm_maps(
    country='中华人民共和国', record='first', only_polygon=True)
fig = plt.figure(figsize=(10, 10))
ax = fig.add_subplot(111, projection=ccrs.PlateCarree())
contours = ax.contour(lons,
                        lats,
                        data,
                        cmap=plt.cm.terrain,
                        levels=np.linspace(-2500, data.max(), 20),
                        transform=ccrs.PlateCarree())
clip_contours_by_map(contours, map_polygon)
clabels = ax.clabel(contours,
                        levels=contours.levels,
                        colors='k',
                        fmt='%i',
                        inline=True)
clip_clabels_by_map(clabels, map_polygon)
draw_map(map_polygon, color='k')
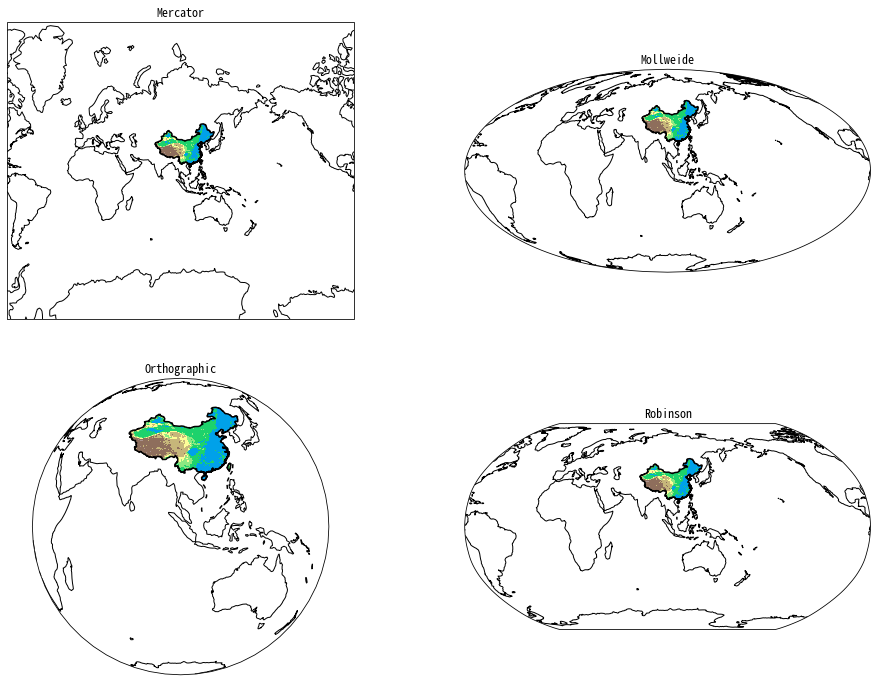
多投影支持
import cartopy.crs as ccrs
import matplotlib.pyplot as plt
from cnmaps import get_adm_maps, draw_map, clip_contours_by_map
from cnmaps.sample import load_dem

lons, lats, dem = load_dem()

PROJECTIONS = [
    ('Mercator', ccrs.Mercator(central_longitude=100)),
    ('Mollweide', ccrs.Mollweide(central_longitude=100)),
    ('Orthographic', ccrs.Orthographic(central_longitude=100)),
    ('Robinson', ccrs.Robinson(central_longitude=100))
]

fig = plt.figure(figsize=(16, 12))
fig.tight_layout()

china = get_adm_maps(country='中华人民共和国', record='first', only_polygon=True)

for i, prj in enumerate(PROJECTIONS):
    ax = fig.add_subplot(2,2,i+1, projection=prj[1])
    cs = ax.contourf(lons, lats, dem, cmap=plt.cm.terrain, transform=ccrs.PlateCarree())
    clip_contours_by_map(cs, china)

    draw_map(china, color='k')
    ax.set_extent(china.get_extent(buffer=3))
    ax.set_global()
    ax.coastlines()
    plt.title(prj[0])

plt.show()